Bid-Ask Spread Patterns and the Optimal Timing for Discretionary Liquidity Traders on Xetra
Jul 1, 2018·, ,,,·
0 min read
,,,·
0 min read
Martin Angerer
Georg Peter
Sebastian Stöckl
Thomas Wachter
Matthias Bank
Marco Menichetti
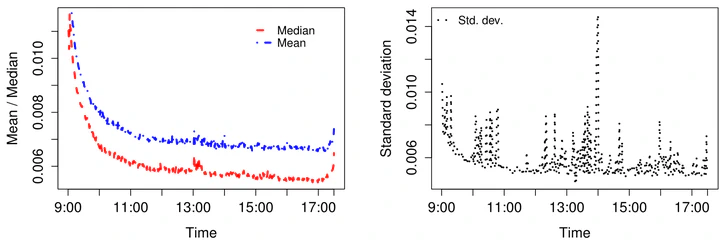 The left-hand side figure shows the cross-sectional mean and median relative bid-ask spread for each minute of a trading day. The plot on the right-hand side depicts the intra-day dynamics of the crosssectional standard deviation of the relative bid-ask spread.
Abstract
This paper explores the statistical and economical significance of intraday and -week patterns in bid-ask spreads. We investigate a large panel of high frequency data for stocks traded on the XETRA trading platform and observe significant patterns in spreads. In addition to showing the robustness of our findings over time, as well as in cross-section, we are also able to demonstrate the patterns’ predictability in an out-of-sample approach. Our findings have clear implications, especially for uninformed but discretionary liquidity traders, which allow significant and economically relevant reductions of transaction costs.
Type
Publication
Schmalenbach Business Review, 70(3), 209-230