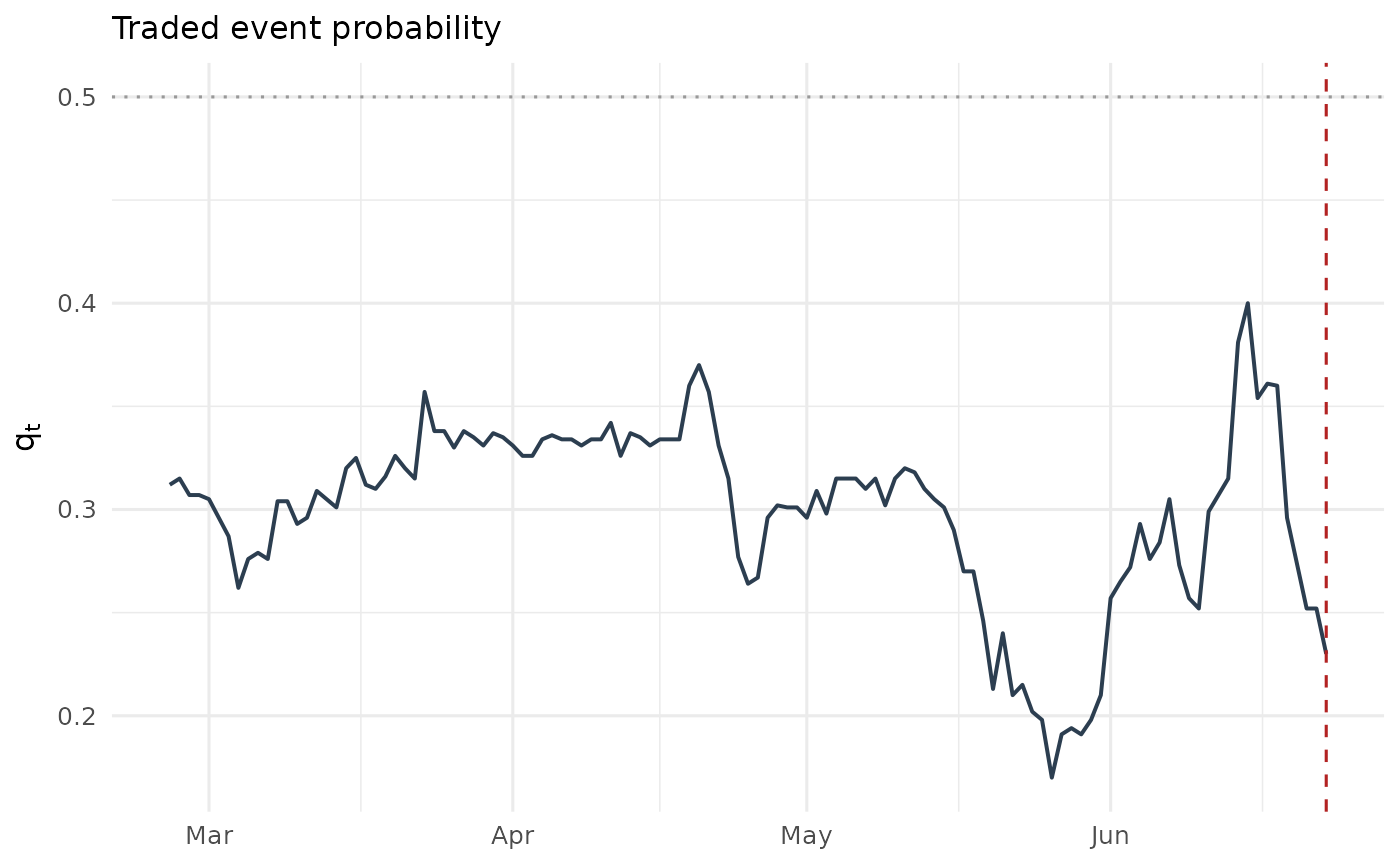
Line plot of the state-price-implied event probability \(q_t\), with an optional marker at the scheduled event date.
Examples
data(brexit2016)
ep <- as_event_prices(brexit2016, time = "date", price = "q_leave",
                      event_date = as.Date("2016-06-23"))
plot_q(ep)