Less Is More: Forecast Granularity, Estimation Error, and Portfolio Choice

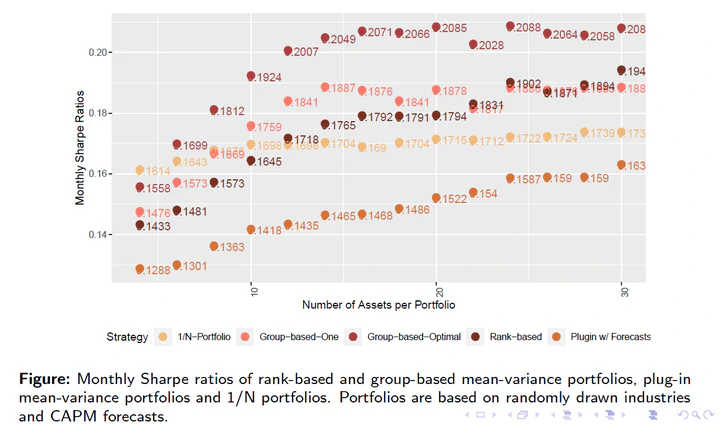 Monthly Sharpe ratios of rank-based and group-based mean-variance portfolios, plug-in mean-variance portfolios and 1/N portfolios. Portfolios are based on randomly drawn industries and CAPM forecasts.
Abstract
An investor who acts on a return forecast chooses how much of it to use. From one identity for the certainty-equivalent loss in risk units we derive the price of every such choice. Each dimension of the forecast the investor acts on costs 1/T, the variance of an estimated Sharpe ratio, whatever signal it carries; each dimension in which he estimates the covariance matrix adds a Wishart factor that grows with the ratio of dimensions to observations. The familiar rules (plug-in, Kan-Zhou, Tu-Zhou, minimum variance, 1/N, decile sorts, parametric tilts) are fixed cells of the resulting grid. The cell that moves sets the number of rank groups from the forecast’s information coefficient and holds 1/N when the forecast cannot rank. On a hundred large CRSP stocks with a machine-learning forecast it earns an annualized Sharpe ratio of 1.2, against 0.6 for 1/N and 1.0 for the decile sort.
Type
Publication
SSRN Scholarly Paper No. 7547959